| The results of TEM-FAST 48HPC electromagnetic surveying
carried out in the northern part of Russian platform.
For comparison the data of logging are shown in the picture as well.

|
| The results of TEM-FAST 48HPC electromagnetic surveying
carried out in the northern part of Russian platform.
For comparison the data of logging are shown in the picture as well.
|
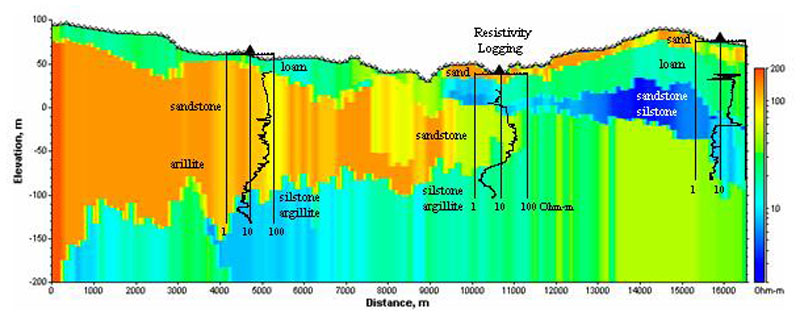 The results of electromagnetic surveying carried out
in Arkhangelsk region (Russia) along profile-2 are shown in the figure.
Resistivity cross-section was constructed on the base of 1D inversion
of TEM-FAST 48HPC data. One-loop configuration of TEM-FAST system with
100*100 m antenna was used at measurements. Vertical color column from
the right side of the picture shows the values of resistivity.
Geological data (type and age of rocks) and logging data are shown in
the figure as well.
The results of electromagnetic surveying carried out
in Arkhangelsk region (Russia) along profile-2 are shown in the figure.
Resistivity cross-section was constructed on the base of 1D inversion
of TEM-FAST 48HPC data. One-loop configuration of TEM-FAST system with
100*100 m antenna was used at measurements. Vertical color column from
the right side of the picture shows the values of resistivity.
Geological data (type and age of rocks) and logging data are shown in
the figure as well.
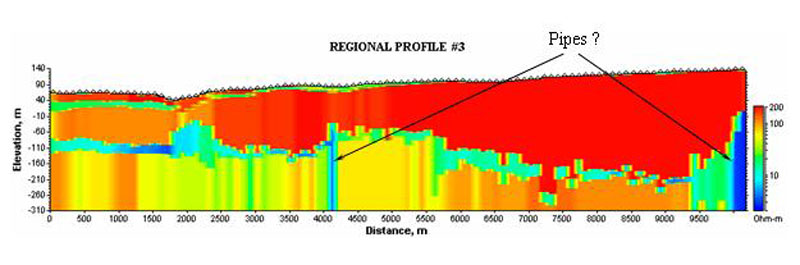 The results of electromagnetic surveying carried out
in Arkhangelsk region (Russia) along profile-3 are shown in the figure.
Resistivity cross-section was constructed on the base of 1D inversion
of TEM-FAST 48HPC data. One-loop configuration of TEM-FAST system with
100*100 m antenna was used at measurements. Vertical color column from
the right side of the picture shows the values of resistivity.
The results of electromagnetic surveying carried out
in Arkhangelsk region (Russia) along profile-3 are shown in the figure.
Resistivity cross-section was constructed on the base of 1D inversion
of TEM-FAST 48HPC data. One-loop configuration of TEM-FAST system with
100*100 m antenna was used at measurements. Vertical color column from
the right side of the picture shows the values of resistivity.
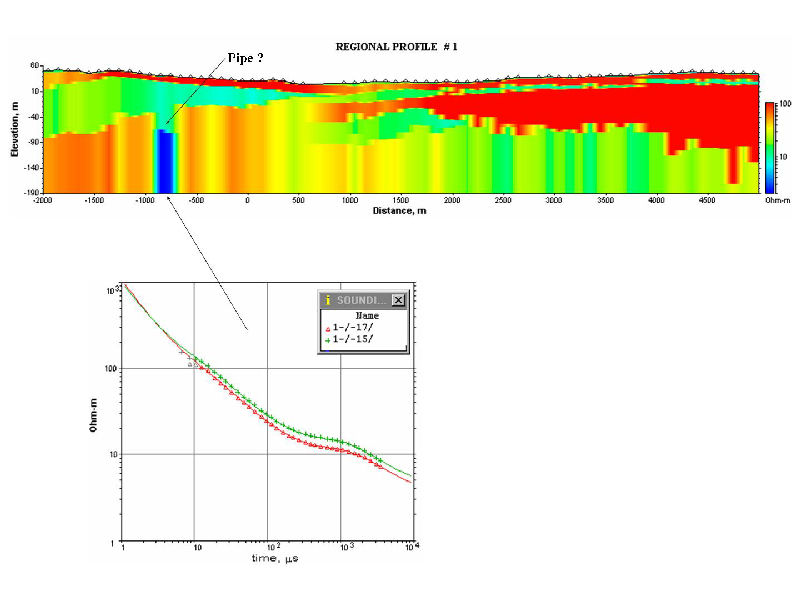
 The results of electromagnetic surveying carried out
in Arkhangelsk region (Russia) along well known Lomonosov pipe
are shown in the figure.
Resistivity cross-section was constructed on the base of two methods:
1D inversion (upper picture) and 1D advanced transformation (low picture)
One-loop configuration of TEM-FAST system with 100*100 m antenna was used
at measurements. Vertical color column from the right side of the picture
shows the values of resistivity.
Geological data (type and age of rocks) are shown in the figure as well.
Main properties of the section are revealed by both methods.
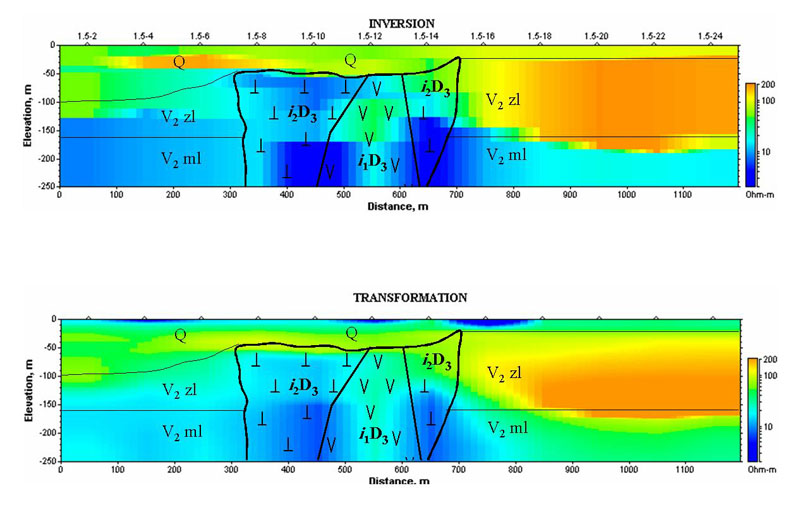
The results of electromagnetic surveying carried out
in Arkhangelsk region (Russia) along well known Lomonosov pipe
are shown in the figure.
Resistivity cross-section was constructed on the base of two methods:
1D inversion (upper picture) and 1D advanced transformation (low picture)
One-loop configuration of TEM-FAST system with 100*100 m antenna was used
at measurements. Vertical color column from the right side of the picture
shows the values of resistivity.
Geological data (type and age of rocks) are shown in the figure as well.
Main properties of the section are revealed by both methods.
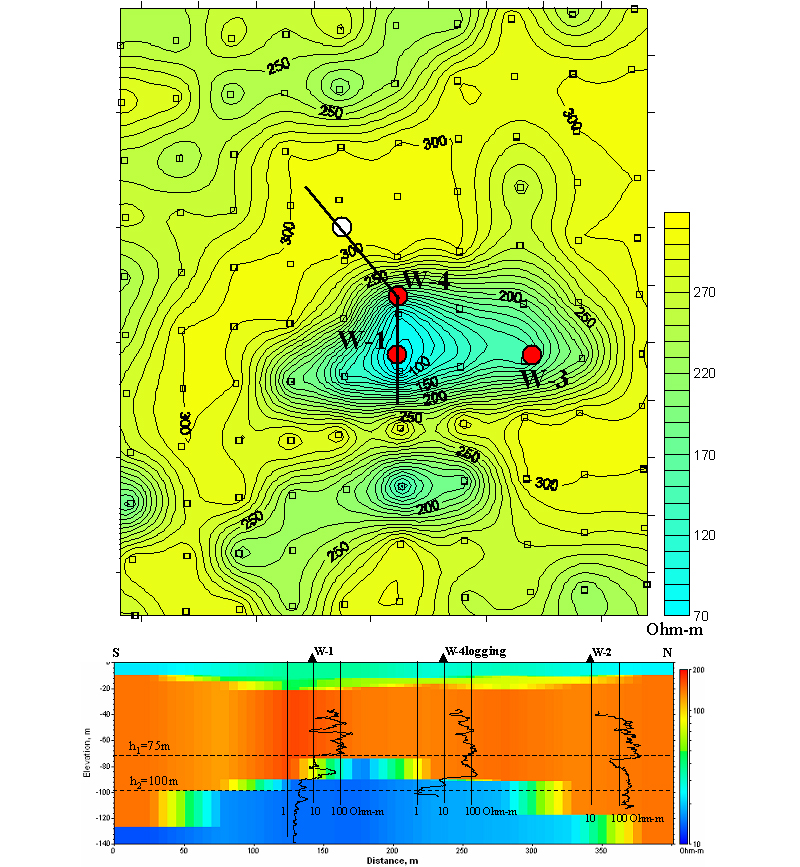
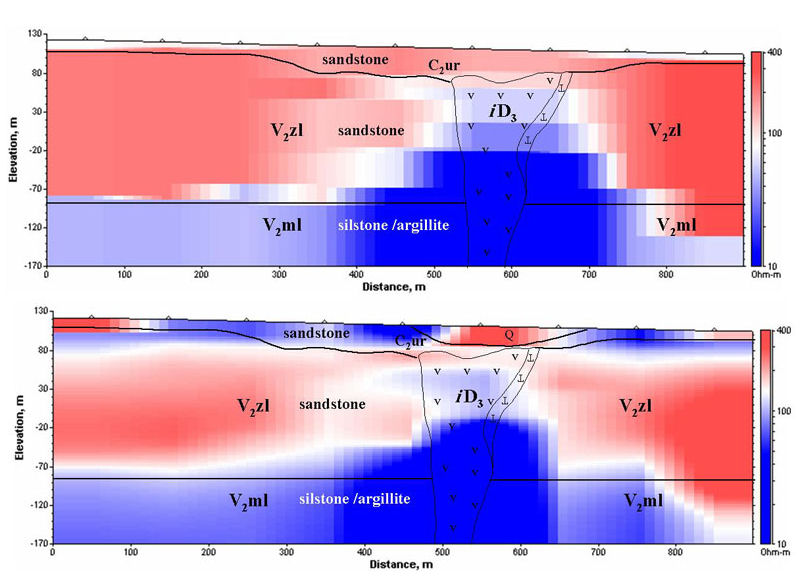 These are results for Pervomajskaya pipe which was well studied.
The notations are the same as for Lomonosov pipe.
These are results for Pervomajskaya pipe which was well studied.
The notations are the same as for Lomonosov pipe.
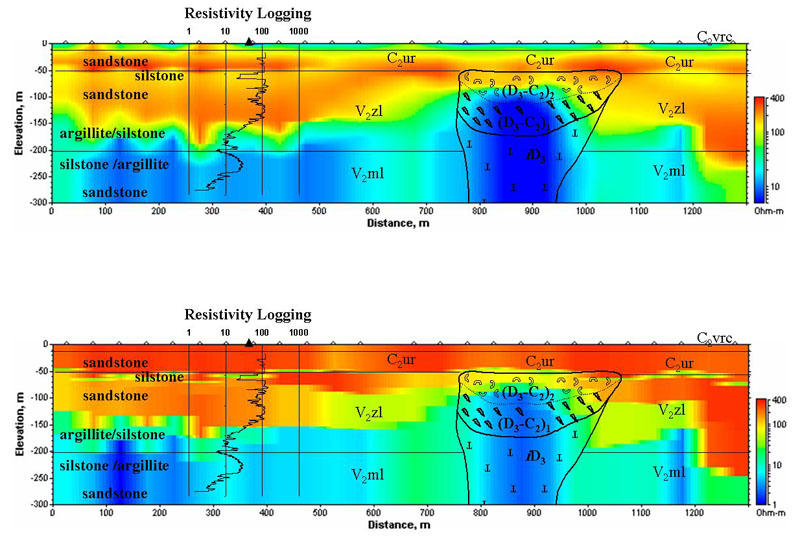 The results of electromagnetic surveying carried out
in Arkhangelsk region (Russia) along well known Pionerskaya pipe
are shown in the figure.
Resistivity cross-section was constructed on the base of two methods:
1D advanced transformation (upper picture) and 1D inversion (low picture)
One-loop configuration of TEM-FAST system with 100*100 m antenna was used
at measurements. Vertical color column from the right side of the picture
shows the values of resistivity.
Geological data (type and age of rocks) an resistivity logging data are
shown in the figure as well. Main properties of the section are revealed
by both methods.
The results of electromagnetic surveying carried out
in Arkhangelsk region (Russia) along well known Pionerskaya pipe
are shown in the figure.
Resistivity cross-section was constructed on the base of two methods:
1D advanced transformation (upper picture) and 1D inversion (low picture)
One-loop configuration of TEM-FAST system with 100*100 m antenna was used
at measurements. Vertical color column from the right side of the picture
shows the values of resistivity.
Geological data (type and age of rocks) an resistivity logging data are
shown in the figure as well. Main properties of the section are revealed
by both methods.